
Dashboard
On the dashboard page, you can see all relevant metrics of your organization and your enrolled devices.
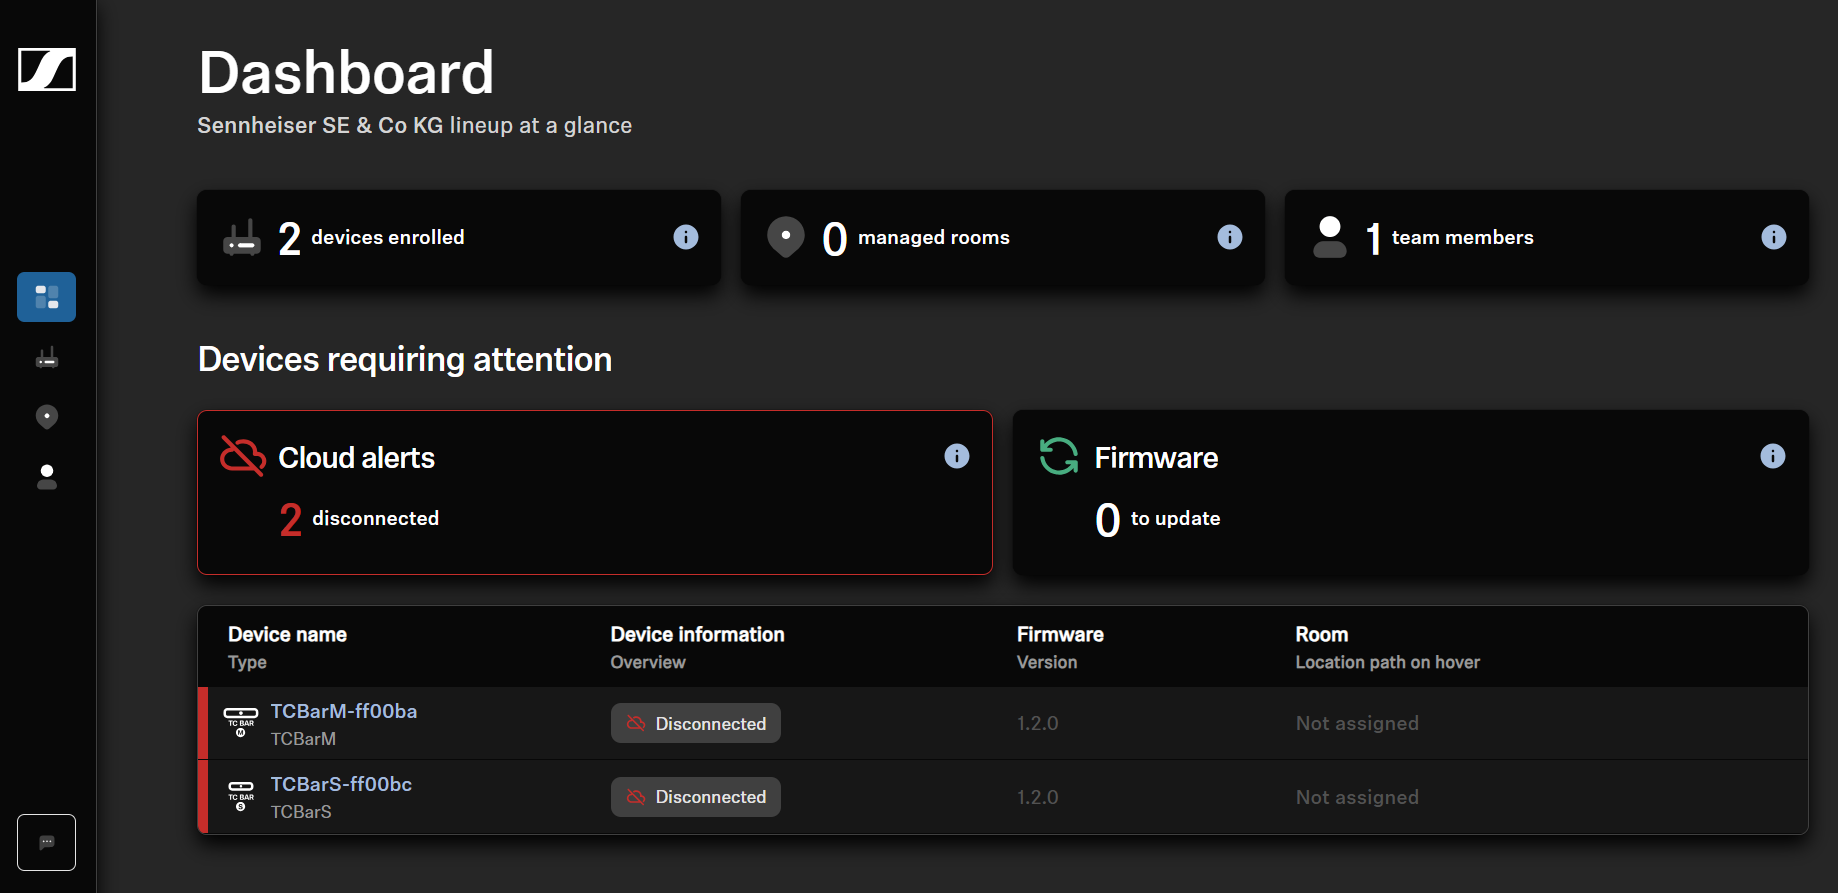
As organization-specific metrics you can see the following statistics:
- Devices enrolled: Total number of devices registered and assigned to your organization
- Managed rooms: Total number of rooms with at least one assigned device in your organization
- Team members: Total number of users with active accounts in your organization
As device-specific metrics you can see the following statistics:
- Cloud alerts: Devices that are currently disconnected from the cloud and cannot be monitored or managed remotely
- Device alerts: Total number of critical alerts across all connected devices that require immediate attention
- Warnings: Total number of non-critical notifications across all connected devices that may indicate misconfiguration
- Firmware: Status of the firmware version of all devices enrolled
The number of enrolled devices may differ from the number shown in the list. This is
because the device list only includes devices that have cloud alerts, device alerts, or
warnings.
Cloud alerts, device alerts, and warnings are shown in the device list below. To filter the list, click the corresponding tile above; only one filter can be applied at a time.
From the device list you can open devices to view detailed information about any
issues. Assigning devices to rooms is not available from the dashboard; you can do this
only from the device list on the Device overview page.