
Mobile Device Monitoring
Here you can monitor the live data of the mobile devices as graphs.
The data is live only, can't be zoomed in to a certain point in time and can't be recorded.
To show the data, click on the grey menu bar Mobile Device Monitoring.
The data is the same as you can see in the mobile device section below.
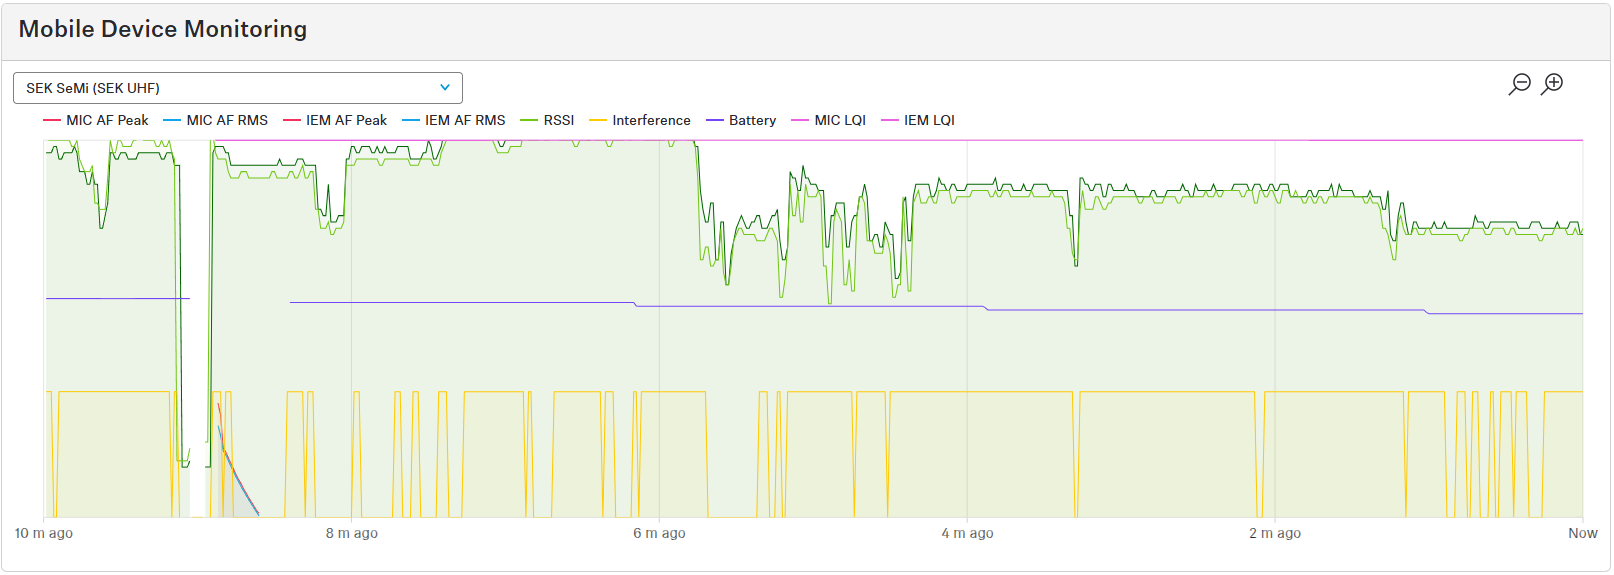
- Switch between the mobile devices.

- Select the prefered data by clicking on the values or double-click to isolate/show all.

- Zoom in or out from 10 h ago to now.

- Hover over the graphs for details.
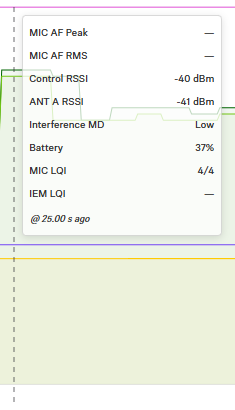
The RSSI graph shows different parameters
- control channel and
- received signal from up to four antennas.
The Interference will be indicated in four steps.
- None
- Low
- Mid
- High