Analyzing the frequency spectrum
-
Change to the “Frequencies/Bands” tab and click on “Analyze frequency spectrum...”.
The analysis result appears in list form in the upper frequency window and is also displayed graphically in the graphical overview.
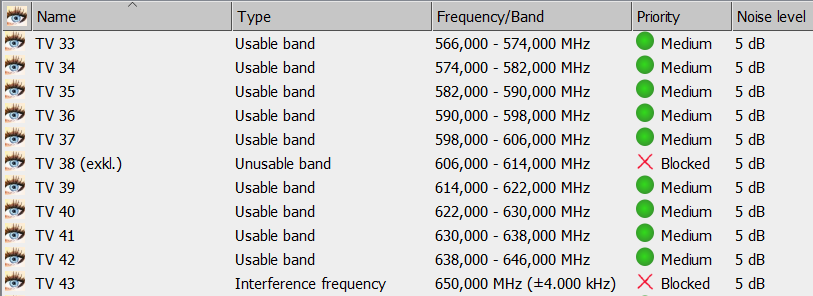
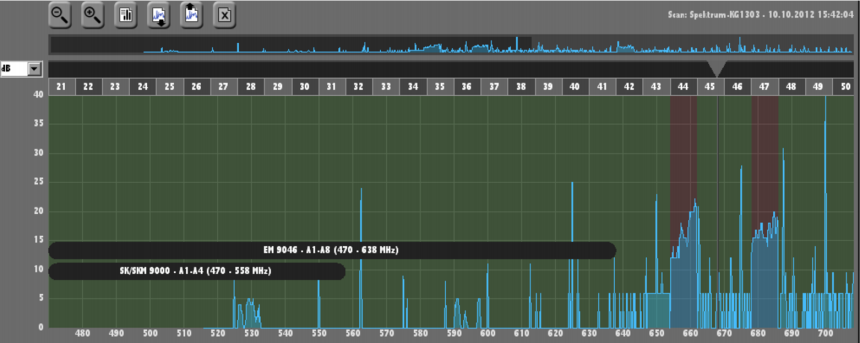
Usable frequency ranges are displayed in transparent green (can be viewed/hidden via the “Usable bands” check box in the “Freq./band filters” area.
Unusable frequency ranges are displayed in transparent red (can be viewed/hidden via the “Unusable bands” check box in the “Freq./band filters” area).
Interference frequencies appear as vertical orange lines (can be viewed/hidden via the “Interference frequencies” check box in the “Freq./band filters” area):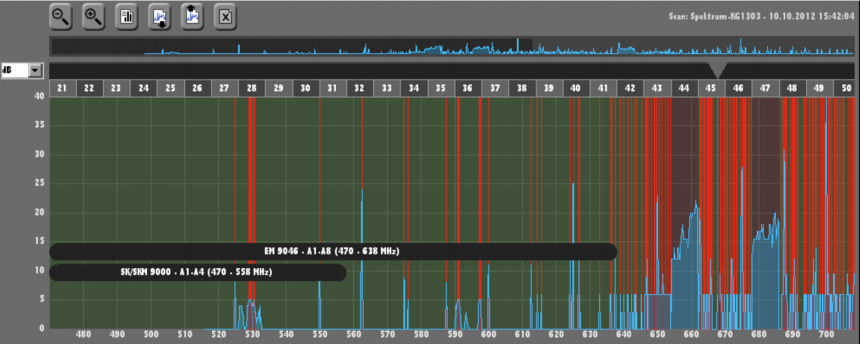
Interference frequencies are not taken into account in the intermodulation calculation and are ignored when new frequencies are placed.
Discrete frequencies appear as vertical green lines (can be viewed/hidden via the “Discrete frequencies” check box in the “Freq./band filters” area):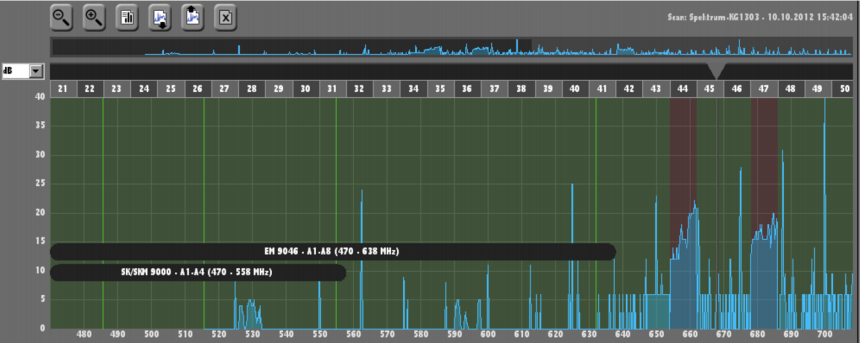
These frequencies can be prioritized in the calculation over overlapping usable frequencies or undefined frequencies by assigning them a higher priority.
-
Evaluate the result of the spectrum analysis:
- Are there any interference frequencies or frequency bands that are marked as occupied but you know for sure that they can be used?
- Are there any frequencies/frequency bands that are marked as usable but you know for sure that they cannot be used?
- Do the settings in the “Priority” column still apply to your current transmission situation?
-
Adjust the result of the frequency spectrum analysis:
- From the upper frequency range, select the entries and click on “Edit freq./bands...”.
- Modify the desired settings.