The “RF Spectrum Analyzer” tool
The “RF Spectrum Analyzer” tool allows you to get a clear picture of the frequency spectrum on location and provides you with all the necessary information for planning your wireless system – more up to date and reliable than any list.
After you have completed the measurement with the “RF Spectrum Analyzer”, you have to set the frequency of the receiver again.
Calling up the “RF Spectrum Analyzer”
- In the system window, click on the “Tools” tab.
- Double-click on the “RF Spectrum Analyzer” icon.


1 Toolbar
2 Selection area

In the selection area, you can:
- select a stationary receiver (see Selecting a stationary receiver for the recording),
- select the frequency range (see Setting the upper and lower limit of the frequency range (Range)) and
- presetthe start time for the recording (see Presetting the start time for the recording).
3 Recording bar
4 “RF Level” window (display range of up to 40 dB max.)
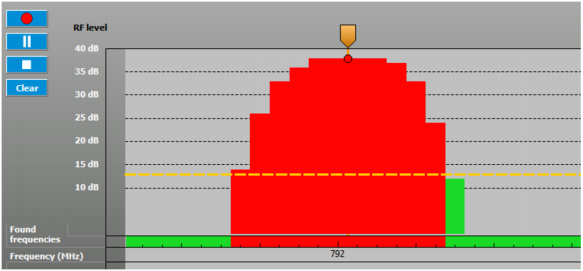
This window displays the measured field strength of the different frequencies within the receiver’s frequency range as vertical bars (display range of up to 40 dB).
The set squelch threshold is given as a reference. The squelch threshold is shown as a horizontal dotted line.

- Green: “free”: The field strength is below the squelch threshold and is displayed as an unused frequency.
- Red: “occupied”: The field strength is above the squelch threshold and is displayed as an occupied frequency.
- Yellow: “squelch”: Squelch threshold.
The squelch threshold can be adjusted in the “Parameter” window (see Setting parameters in the “Properties” window).
5 “Memory”, “Found Frequencies” and “Frequency (MHz)” displays
“Found Frequencies” display
The “Found Frequencies” displays the occupied frequencies detected during the recording as red squares.
“Frequency (MHz)” display
The frequencies are shown on the x-axis of the “Frequency (MHz)” line. The frequency range depends on the selected receiver and the setting made under “Set Frequencies”.
“Memory” display
The “Memory” display is only shown if a recording from the temporary memory is displayed (see Temporarily saving recordings and comparing them).
6 Display of the current date and time
The current date and time are displayed. Date and time are taken from the operating system.

7 “Comment” field
Important occurrences can be marked and commented. The markers are displayed as vertical blue lines. A blue flag appears above them.
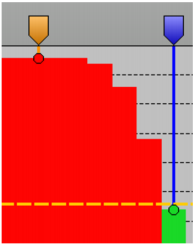
When you click on a marker, the line and the flag turn to orange. When you move the mouse pointer over a marker, a box will appear above the marker, indicating the time and the measured field strength of both antennas.

When you have clicked on a marker, you can enter a comment in the “Comment” field. A “C” appears in the flag of the marker. The comment is displayed again when you click on the marker (see Marking measured values and commenting on them).